
On 28 October 2026 the Agriculture and Food Authority notified exporters, importers and processors that it was closing the 2026/27 harvesting season for sea shipment of Hass, Fuerte, Pinkerton and Jumbo avocados from 30 October, after a nationwide survey found supplies too low to sustain shipments. Air freight continues. The notice also directs oil processors holding export stocks to request verification by 2 November 2026 and warns that processors who breach the closure risk losing their export licences (verified). The fresh trade the notice constrains earned about US$160.1 million (KSh 20.8 billion) in 2025 from 120,893 tonnes (verified). Fresh avocado must be picked at the right maturity, chilled within hours, carried across an ocean and sold within weeks, and every link in that chain can break. Oil needs no cold chain and keeps for months, although as the notice shows it sits inside the regulator’s reach, and the freeze sharpens a question that investors and policymakers should ask directly.
Most commentary on avocado oil compares the price of a kilogram of oil with the price of a kilogram of fruit, which flatters the oil by a factor of about ten, because roughly ten kilograms of fruit go into every kilogram of oil (indicative). The correct unit is the kilogram of fruit that enters the factory gate. The question then becomes which outlet pays the most per kilogram of fruit for each grade of fruit, and what price the oil must reach to beat the alternative.
Recalculated on that basis, the answer is more demanding than the usual story. At an extraction rate of 10 percent, crude oil must sell for about US$3.10 per kilogram to match the average farm-gate price, about US$6.20 to match the 2025 domestic market price of local varieties, and between US$13.20 and US$16.80 to match export-grade fruit sold fresh (all derived). Kenyan crude oil in 2026 trade records sold at US$4.61 to US$5.73 per kilogram (indicative), which clears the first hurdle only. Finished oil at French and New Zealand transaction prices (indicative) reaches the lower end of the fresh benchmark and, in the New Zealand case, exceeds it by a wide margin. The working thesis is that crude pressing is a salvage outlet for fruit bought near farm-gate prices, mainly the reject and grade-out fruit of packhouses, whereas only refined and branded oil can compete with fresh fruit for the best fruit.
These are threshold tests on gross revenue and nothing more. They identify where a finished-oil strategy deserves detailed study, and they do not show that diverting export-grade fruit into oil is commercially viable. That depends on contribution margin per kilogram of fruit, which is revenue after refining losses, energy, labour, packaging, financing and marketing, less the cost of the fruit, and none of those costs is publicly reported for Kenya. The article keeps the distinction between gross revenue and contribution margin explicit throughout, and it ends with a sequenced roadmap for government and investors, supported by technical annexes.

How to read the evidence in this article
Avocado statistics for Kenya are patchy and sources disagree, so every figure carries one of four grades. Verified means traceable to an official source, whether a statistic, a statutory rule or a regulator notice, including through reliable secondary reporting. It does not mean that Uratibu has examined the underlying primary document.
| Grade | Meaning | Typical examples |
|---|---|---|
| Verified | Traceable to an official source, including through reliable secondary reporting. | KNBS production data, 2025 export tonnage and value, SEZ tax rates, the AFA closure notice |
| Estimate | Agency estimate, official statement or forecast that has not been reconciled with other sources. | USDA production estimate, 2026 forecasts, AFA statements, oil processing volume |
| Derived | Uratibu arithmetic using verified or estimated inputs, with the method shown in Annex B. | Per-kilogram values, shares, break-even prices, illustrations of policy outcomes |
| Indicative | Price samples from trade aggregators, supplier claims, market research forecasts and assumptions. | Oil prices, extraction yields, global oil market size, processor capacity claims |
Kenya in the global league table
Avocado production is concentrated in a handful of countries. Using FAOSTAT figures for 2022 (verified), the five largest producers accounted for roughly two thirds of a world crop of about 9.0 million tonnes, with Mexico alone at 28 percent (derived). Kenya ranked sixth in 2023 behind Mexico, Colombia, the Dominican Republic, Peru and Indonesia, and it is the only African country in the top tier.
| Producer | Production 2022 (tonnes) | Share of world | Grade |
|---|---|---|---|
| Mexico | 2,529,581 | 28.2% | Verified, share derived |
| Colombia | 1,090,664 | 12.1% | Verified, share derived |
| Peru | 866,457 | 9.6% | Verified, share derived |
| Dominican Republic | 737,201 | 8.2% | Verified, share derived |
| Kenya | 458,439 | 5.1% | Verified, share derived |
| Rest of world (includes Indonesia) | 3,295,899 | 36.7% | Verified, share derived |
Shares are calculated from the table totals.
Production rank understates Kenya’s trade weight, because countries such as Indonesia consume most of what they grow, whereas Kenya sells a large share abroad. Mexico exported about 1.22 million tonnes and Peru about 598,000 tonnes, so Kenya’s roughly 121,000 tonnes amounts to about a tenth of Mexico’s volume (estimate and derived, because the years are not identical). Kenya was Africa’s leading exporter by volume in 2025, and the director of AFA’s Horticultural Crops Directorate has said the country aims to become the third largest exporter in the world (both estimate).
Where Kenya stands out is yield. FAO-based figures show about 16.2 tonnes per hectare in 2023, ahead of Peru at 15.6 and Indonesia at 13.4 (verified). Mexico’s 2.97 million tonnes on 253,309 hectares implies roughly 11.7 tonnes per hectare, which means Kenya produced about 18 percent of Mexico’s tonnage from about 13 percent of its harvested land (derived). Only the Dominican Republic at 21.2 tonnes and Brazil at 18.6 did better among the major producers. Kenya’s altitude, rainfall and two harvest windows are therefore real advantages, and the challenge lies in what the country does with the crop after harvest.
The macro picture
Avocado was Kenya’s sixth largest agricultural export by value in 2025 (estimate). AFA reports that exports grew from about 31,000 tonnes in 2015 to more than 128,000 tonnes in 2025, and that close to half of export value flows back to farming families (both estimate). Official trade data give a slightly different figure for the latest year, with 120,893 tonnes and US$160.1 million (verified), and USDA reports 121,000 tonnes and US$159.1 million. USDA attributes the 2025 decline from its earlier projection of 135,000 tonnes to premature harvesting, shipping disruption and stricter AFA rules on sea shipments from 20 October 2025.
| Indicator, 2025 | Value | Grade |
|---|---|---|
| Production, KNBS provisional | 528,300 tonnes | Verified |
| Production, USDA estimate | 694,000 tonnes | Estimate |
| Area harvested (KNBS) and planted (USDA) | 31,632 ha and 35,600 ha | Verified, Estimate |
| Average yield, KNBS | 16.7 tonnes per hectare (20.2 in 2023) | Verified |
| Average yield, USDA | 19.5 tonnes per hectare | Estimate |
| Farm-gate value of crop | KSh 21.3 billion | Verified |
| Fresh avocado exports | 120,893 tonnes, US$160.1 million | Verified |
| Top two markets by value | Netherlands US$38.8m, UAE US$30.9m | Verified |
| Hass share of production | 74.2% | Estimate |
| Domestic consumption | Nearly half, about 340,000 tonnes | Estimate |
| Oil processing volume | 10,188 tonnes (3,326 in 2024) | Estimate |
Four macro findings stand out. First, the two leading production estimates differ by about 31 percent, with KNBS at 528,300 tonnes and USDA at 694,000 tonnes, and their average yield estimates differ by about 17 percent (both derived), so national planning rests on a base that nobody can yet state with confidence. Second, the Netherlands and the UAE together took US$69.7 million, or 43.5 percent of export value (derived), so the trade is concentrated in two destinations. Third, fresh exports of about 121,000 tonnes represent only 17 percent of the USDA crop estimate or 23 percent of the KNBS estimate (derived), and the remainder is eaten locally, lost, or pressed. Fourth, USDA’s own description of the sector is that nearly half of production is consumed at home and that unused fruit is composted, so the residual that could feed an oil industry is real but smaller than headline gaps suggest.
The official outlook remains ambitious, with USDA forecasting production of 727,000 tonnes and exports of 130,000 tonnes in 2026, and a revenue projection of about KSh 25.4 billion or US$170 million circulating in industry media (estimate). The sea export freeze will test those numbers.
The micro picture, from orchard to press
Farmers received an average of KSh 4,030 per 100 kilograms in 2025, up from KSh 3,824 the year before (verified). That is about KSh 40 per kilogram, or roughly US$0.31 at the exchange rate of about KSh 130 to the dollar implied by the export figures, against a fresh export unit value of about US$1.32 per kilogram (both derived). AFA data show monthly export prices between US$1,390 and US$1,680 per tonne in 2025, which would put the fresh benchmark as high as US$1.68 per kilogram (estimate). The gap between farm gate and export reflects sorting, packing, cold storage, freight and exporter margin.
The Ministry of Agriculture and Livestock Development reports higher domestic market prices, at US$0.62 per kilogram for local varieties, US$0.71 for Fuerte and US$0.98 for Hass in 2025 (verified). These are not reconciled with the KNBS farm-gate average and the two series may measure different points in the chain. They matter for processors, because a pressing plant competes for fruit at market prices and not at an average farm-gate price. Fuerte and local varieties generally trade lower when sold for processing.
At the KNBS average yield of 16.7 tonnes per hectare, a hectare grosses about KSh 673,000, or roughly US$5,200, at the average farm-gate price (derived). Industry sources report that about 80 percent of Kenyan avocado farmers are smallholders (estimate). Returns are respectable but fragile, because yields fell about 17 percent between 2023 and 2025 on KNBS figures (derived), and immature harvesting driven by price pressure damages both fresh quality and oil yield.
The unit economics of a pressing plant
Industry sources describe Kenyan Hass as yielding about 8 to 12 percent crude oil by fruit weight, against 12 to 18 percent for optimal Mexican material (indicative, supplier claims). Consider a plant that buys 1,000 tonnes of fruit and sells crude oil at US$5.00 per kilogram. The table shows the gross spread over fruit cost at two fruit prices, the KNBS average farm-gate price of US$0.31 per kilogram and the 2025 domestic market price of local varieties at US$0.62.
| Extraction rate | Oil produced | Oil revenue | Spread at fruit cost US$0.31 per kg | Spread at fruit cost US$0.62 per kg |
|---|---|---|---|---|
| 8% | 80 tonnes | US$400,000 | US$90,000 | Minus US$220,000 |
| 10% | 100 tonnes | US$500,000 | US$190,000 | Minus US$120,000 |
| 12% | 120 tonnes | US$600,000 | US$290,000 | Minus US$20,000 |
Derived from indicative inputs. This is a gross spread over fruit cost and not a profit figure. It excludes energy, labour, logistics, financing and by-product income from cake and seed.
The result is stark. A crude oil plant earns a positive spread only when it buys fruit near the farm-gate average, and it loses money on gross spread alone at every extraction rate when it pays the domestic market price for local varieties. That explains why crude pressing works best as an outlet for reject and grade-out fruit that fresh packhouses would otherwise discard, and why it is poorly placed to bid against fresh markets for general supply. Each percentage point of extraction is worth about US$50,000 per 1,000 tonnes of fruit at these prices (derived), which is why maturity and dry matter discipline matter as much to the processor as to the fresh exporter.
How avocado becomes crude oil
The pressing process follows a well-established industrial sequence, and the quality of the crude oil is largely settled before the fruit reaches the press. The steps below describe general industry practice and are not drawn from any single Kenyan plant.
- Sourcing and grading. Fruit arrives from orchards, aggregators and the reject lines of fresh packhouses. Oil content rises with maturity, so dry matter testing at intake protects both yield and compliance with AFA season rules.
- Washing and preparation. Fruit is washed, and depending on the plant design is destoned or peeled, then milled into a paste.
- Malaxation. The paste is mixed slowly, often with gentle warming, to coalesce oil droplets and improve release.
- Decanting. A decanter centrifuge separates the paste into oil, water and solids. Cold-pressed and extra virgin grades keep temperatures low, whereas high-yield lines accept more heat.
- Polishing and filtration. A second centrifuge and filters remove fine solids and moisture, and the oil is flushed with nitrogen to slow oxidation.
- Quality control and storage. Crude oil is typically specified by free fatty acid content (supplier specifications cite 2 percent or below) and peroxide value (cited at 20 or below), with a certificate of analysis for each lot (indicative).
- Co-products. The pressed cake and seed can be sold as feed, fertiliser or extraction feedstock, and a plant that plans for these streams improves its margin.
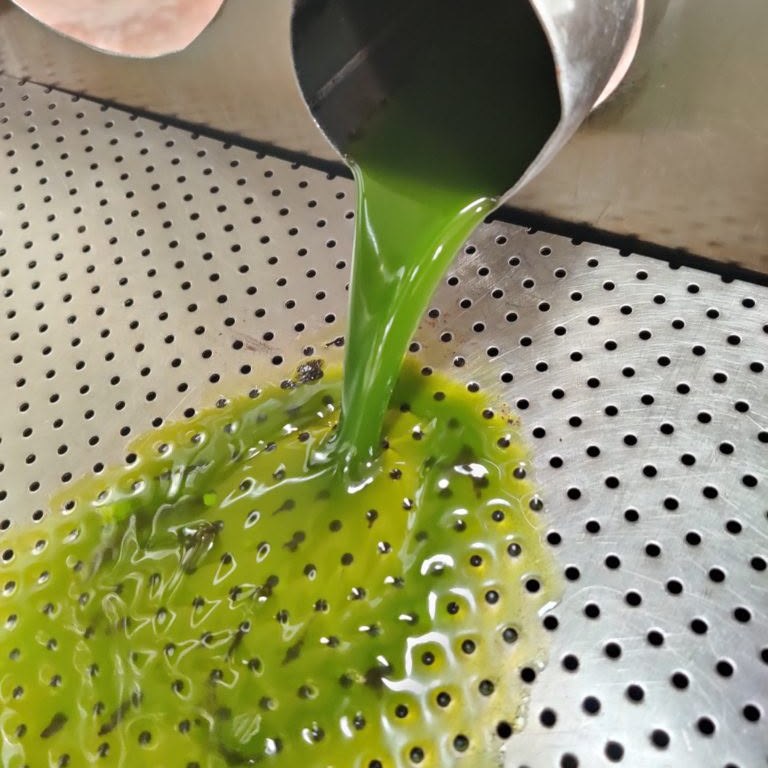
Crude oil is not the end of the chain. It goes to refiners abroad who neutralise, bleach and deodorise it for culinary use, or who polish and fractionate it for cosmetic and pharmaceutical applications, where the unsaponifiable fraction commands the highest prices. Most of the value is created in these later steps.
The export mechanics
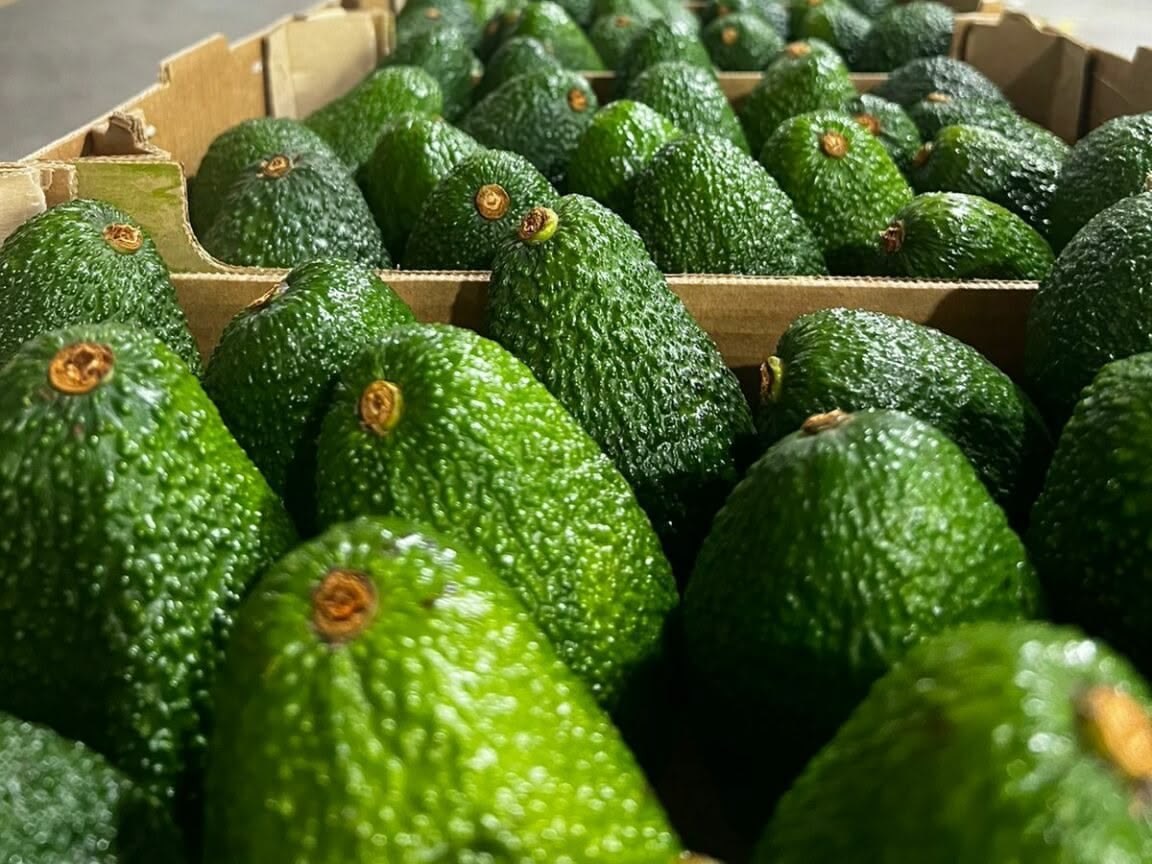
Crude avocado oil is classified under HS 1515.90, the heading for other fixed vegetable fats and oils, and shipping records use that code (indicative, from trade records). Avocado oil shares the six-digit heading with other oils, which is why public data on Kenya’s oil exports are so thin.
- Licensing and fruit sourcing. Processors source fruit within the Crops (Horticultural Crops) Regulations 2020 administered by AFA through the Horticultural Crops Directorate, including season and maturity rules (verified). Industry reports indicate that higher maturity thresholds applied to oil fruit in the 2026 season (estimate).
- Regulatory verification. The October 2026 notice requires processors holding export stocks of oil to request verification by the Directorate, and it states that only verified stocks will be cleared (verified). One regional outlet also reports a halt on imported fruit for processing, which other reports do not mention and which should be treated as unconfirmed.
- Processing location. Several exporters operate within Export Processing Zones, for example Fairoils EPZ Ltd, which shipping records show supplying a United States buyer, and the Chinese-owned Sanmark plant at Athi River (indicative, drawn from trade records and press reports). EPZ status gives duty-free inputs and the EPZ tax regime.
- Packing. Crude oil moves in 200 litre drums, ISO tanks or flexitanks. Shipping records show 20 foot containers carrying about 21 to 22 tonnes of oil in a flexitank (indicative).
- Documentation. A typical file includes the commercial invoice, packing list, bill of lading, certificate of origin (or EUR.1 where EU preference is claimed), certificate of analysis, and the electronic cargo tracking note. United States shipments also require FDA registration numbers for the exporter and consignee, as the shipping records show.
- Terms and payment. Sales are commonly priced free on board at Mombasa, with payment by letter of credit or telegraphic transfer, and pricing is usually benchmarked against refined vegetable oil markets and the buyer end use (general industry practice).
- Destinations. The main markets for Kenyan crude avocado oil are Italy, Spain, Mexico, Portugal, France and the United States (estimate), and trade samples also show shipments to India (indicative). China reportedly offers zero-tariff access for African products, which has encouraged investment in Kenyan processing (indicative, reported by industry media and not independently confirmed).
- Indirect tax at the border. Exports are zero-rated for VAT, so the exporter charges no output VAT and reclaims input VAT, and the speed of those refunds is a recurring working capital concern for the industry (rule verified, delays reported by industry).
International taxation and who keeps the margin
Kenya’s tax system is built to attract export processing, and the headline terms are generous (verified). The SEZ Authority publishes a corporate tax rate of 10 percent for ten years, 15 percent for the next ten and 30 percent thereafter, with exemption from import duty, excise and VAT on imported goods, zero-rated local supplies, a 100 percent investment deduction on buildings and machinery, and withholding tax exemption on dividends and, in the first ten years, on royalties, interest and service fees paid to non-residents. Enterprises in an Export Processing Zone receive a ten-year corporate tax holiday and a 25 percent rate for a further ten years, a ten-year withholding tax holiday, and VAT and customs duty exemption on industrial inputs, and authorities moved in November 2024 to align the EPZ and SEZ frameworks in most respects, apart from VAT treatment. Standard corporate tax is 30 percent.
The harder questions sit beyond the incentive schedule.
- Transfer pricing. Many crude oil sales go to related refiners and distributors abroad. Kenya taxes only the margin booked in Kenya, so the price at which crude leaves the country decides how much taxable profit stays. Processors should benchmark prices against comparable uncontrolled transactions and keep contemporaneous documentation under the Kenyan transfer pricing rules.
- Tariff escalation. Importing countries have traditionally levied lower duties on raw materials than on processed goods, which discourages beneficiation in the exporting country. The Kenya and EU Economic Partnership Agreement, signed in December 2023, removes this barrier for Kenya in the EU market, but Peru, Colombia and Chile hold similar EU access, so it levels the field and does not tilt it.
- Global minimum tax. The Tax Laws (Amendment) Act 2024 introduced a domestic minimum top-up tax from 1 January 2025 for entities in multinational groups with consolidated revenue of at least 750 million euros in two of the previous four years, which in principle can erode a 10 percent SEZ rate for those groups (verified). Draft regulations were issued in November 2025 and their current status should be checked. Most Kenyan processors fall far below the threshold, but a global buyer building a Kenyan refinery would need to model it.
- Withholding and treaties. Payments abroad for licences, technical services and management fees can attract withholding tax, and the SEZ exemption window and Kenya’s treaty network shape the true cost of foreign technology partnerships.
- Refund friction. Zero-rating helps only if input VAT is refunded promptly. Delays turn a VAT neutral regime into an interest-free loan to the state, and that cost lands hardest on small processors.
Tax descriptions are general and should be checked against the current Finance Act and with qualified advisers before any investment decision.
The value ladder, recalculated per kilogram of fruit
Industry commentary often says avocado oil sells for four times the price of fresh fruit. Trade records show Kenyan crude oil shipped to India at US$4.61 to US$5.73 per kilogram in 2026 (indicative), against a fresh export unit value of about US$1.32 per kilogram (derived), which is where a multiple of 3.5 to 4.3 comes from. That compares a kilogram of oil with a kilogram of fruit, however, and it takes about ten kilograms of fruit to make a kilogram of oil. The first table restates each outlet as the gross revenue earned per kilogram of fruit, across the reported extraction range.
| Outlet for the fruit | Price per kg of product (US$) | Per kg of fruit at 8% | Per kg of fruit at 10% | Per kg of fruit at 12% | Grade |
|---|---|---|---|---|---|
| Average farm-gate fruit (KNBS) | 0.31 | 0.31 | 0.31 | 0.31 | Derived from verified |
| Domestic market, local varieties 2025 | 0.62 | 0.62 | 0.62 | 0.62 | Derived from verified |
| Fresh fruit at export unit value | 1.32 | 1.32 | 1.32 | 1.32 | Derived from verified |
| Crude oil, Kenyan trade records 2026 | 4.61 to 5.73 | 0.37 to 0.46 | 0.46 to 0.57 | 0.55 to 0.69 | Indicative |
| Finished oil, French transactions Dec 2025 | 13.77 | 1.10 | 1.38 | 1.65 | Indicative |
| Finished oil, New Zealand transactions Dec 2025 | 25.16 | 2.01 | 2.52 | 3.02 | Indicative |
Gross revenue per kilogram of fruit, before refining loss, processing cost, packaging and marketing. Oil prices come from trade data aggregators and are not official statistics.
The second table turns the arithmetic around and shows the oil price needed to match each alternative use of the fruit.
| Oil price needed to match the alternative (US$ per kg of oil) | At 8% | At 10% | At 12% | Grade |
|---|---|---|---|---|
| Average farm-gate fruit at US$0.31 per kg | 3.88 | 3.10 | 2.58 | Derived |
| Local varieties at the domestic market price of US$0.62 | 7.75 | 6.20 | 5.17 | Derived |
| Fuerte at the domestic market price of US$0.71 | 8.88 | 7.10 | 5.92 | Derived |
| Hass at the domestic market price of US$0.98 | 12.25 | 9.80 | 8.17 | Derived |
| Export-grade fruit sold fresh at US$1.32 per kg | 16.55 | 13.24 | 11.03 | Derived |
| Export-grade fruit at the AFA peak monthly price of US$1.68 per kg | 21.00 | 16.80 | 14.00 | Derived |
A threshold test, and not proof of viability
The third table shows the gross headroom that finished oil offers over the fresh export unit value, meaning the extra revenue per kilogram of fruit before any cost is deducted.
| Gross headroom over fresh export (US$ per kg of fruit) | At 8% | At 10% | At 12% | Grade |
|---|---|---|---|---|
| Finished oil at the French transaction price of US$13.77 | Minus 0.22 | 0.05 | 0.33 | Derived from indicative |
| Finished oil at the New Zealand transaction price of US$25.16 | 0.69 | 1.19 | 1.70 | Derived from indicative |
These figures are a screening device and not evidence that diverting export-grade fruit into oil would pay. The distinction that matters is between gross revenue per kilogram of fruit and contribution margin per kilogram of fruit. Contribution margin is the gross revenue after refining losses, energy, labour, packaging, freight to the buyer, financing and marketing, less the cost of the fruit. The owner of export-grade fruit should compare that margin with the net-back from selling fresh, which is the export unit value less packing, cold chain, freight and exporter margin. The fresh export unit value is a free-on-board figure that already carries those costs, so comparing gross figures overstates the fresh alternative as well as the oil alternative, and a net-back comparison is the right standard. No such cost data are published for Kenya.
Two practical readings follow. At the French transaction price the headroom is about US$0.05 per kilogram of fruit at a 10 percent extraction rate, which any realistic refining loss or packaging cost would consume, so finished oil at commodity-grade prices should not be assumed to beat fresh fruit. At New Zealand prices the headroom is about US$1.19, which suggests that the case lies in premium, branded, cosmetic or pharmaceutical positioning. Crude pressing remains attractive for fruit that has no fresh outlet, and the roadmap below therefore gates any large refining investment on a plant-level net-back study.
The global avocado oil market was estimated at about US$660 million in 2025 and is forecast to grow at roughly 8 percent a year toward US$1.1 billion by 2032 (indicative, because estimates vary widely between research houses). On that estimate Kenya’s fresh exports alone equal about a quarter of the whole oil market (derived), which shows how much value the finished segment holds relative to the fruit that feeds it.
How Kenya compares with the leading powers
| Country | Position | Lesson for Kenya | Grade |
|---|---|---|---|
| Mexico | Largest producer at about 3 million tonnes, with Michoacan supplying close to 80 percent. Leads in avocado oil shipment records and exports about 1.2 million tonnes fresh. | Scale and a dedicated processing industry absorb the surplus, but concentration in one state is a risk Kenya can avoid by spreading across counties. | Estimate |
| Peru | Third largest producer and second largest exporter with about 598,000 tonnes. Supplies dehydrated, cold-pressed avocado for French pharmaceutical use. | A pharmaceutical customer pays for traceability and consistency, which Kenya can build with smallholder aggregation. | Estimate |
| New Zealand | Small volumes, yet transactions near US$25 per kilogram of finished oil. | Brand, certification and story set the price, and volume does not. | Indicative |
| South Africa | Africa’s other major exporter, with integrated players such as Westfalia listed among global oil suppliers. | Vertical integration from orchard to oil lets one firm capture the full chain. | Estimate |
| Tanzania and Uganda | Avo Africa commissioned a large Tanzanian plant in January 2025 and Ugandan crude oil is already shipping. | Regional rivals are building capacity, so the window to lead East African oil is open now and will not stay open. | Indicative |
The best case for Kenya
Kenya cannot beat Mexico on scale, and nobody should pretend otherwise. It can win on a different axis, and the argument rests on five pillars.
- Yield and agronomy. Kenya out-yields Mexico per hectare, grows through two seasons, and has more room to expand into suitable counties than most competitors.
- A surplus that needs a home. Nearly half the crop is consumed domestically (estimate) and a share of the remainder fails fresh export standards. A processing industry that buys reject and grade-out fruit converts that surplus into export revenue, which turns quality enforcement from a threat to farmers into a supply channel for them.
- Resilience to freight and cold chain shocks. Oil does not need a reefer, does not spoil in a Red Sea diversion and does not depend on a two-week arrival window. Oil remains exposed to regulatory risk, as the October 2026 verification requirement shows, so the hedge is against logistics and not against policy.
- Fiscal architecture. The EPZ and SEZ regimes, EPA access to Europe and growing Asian market access already exist, so the tax and tariff tools are in place and need better execution, not invention.
- A traceable smallholder story. Cosmetic and pharmaceutical buyers pay for provenance and social impact, and Kenyan production is dominated by smallholders organised into cooperatives and aggregators that can document origin.
The case carries honest caveats. Crude oil earns a modest margin per kilogram of fruit and loses money on gross spread if fruit is bought at market prices, extraction yields reportedly trail Mexican benchmarks, production statistics are unreliable, climate shocks cut yields in 2024, and the fresh and oil trades compete for the same mature fruit. The strategy works only if the country moves up the ladder in a disciplined way and tests each step against net-back economics.
An implementation roadmap
The seven actions below are sequenced in three phases, starting with measurement and the removal of known frictions, then setting rules and standards, and only then committing capital. Lead institutions and timings are Uratibu proposals for discussion and do not describe existing mandates or commitments. Outcome figures are illustrations built from derived and indicative inputs, so they should be read as orders of magnitude and not as forecasts. Calculations and assumptions sit in Annex A and Annex B.
Phase 1, measure and unblock (0 to 12 months)
1. Create a dedicated tariff line and export statistic for avocado oil.
Lead: KRA Customs, with National Treasury, KNBS and the EAC Secretariat. Timing: 6 months.
Action: add a national statistical sub-heading under HS 1515.90 and publish monthly volume and value by destination, subject to EAC customs union procedures.
Outcome: oil exports become measurable for the first time. The success measure is a published monthly series. No revenue effect is claimed.
2. Reconcile the national production base.
Lead: KNBS, with the AFA Horticultural Crops Directorate and the Ministry of Agriculture and Livestock Development. Timing: 12 months.
Action: align KNBS, AFA and USDA definitions of area, yield and Hass share and publish one annual figure with a stated margin of error.
Outcome: the gap between KNBS and USDA production estimates falls from about 31 percent to a proposed 10 percent or less (Annex B, B11).
3. Set and enforce a VAT refund timeline for exporters in the oil chain.
Lead: KRA, with National Treasury and exporter associations. Timing: 6 to 12 months.
Action: create a fast-track channel with a proposed 60 day decision window and interest on late refunds, which may need a legislative amendment.
Outcome: lower financing cost, worth about US$12,300 per US$1 million of claims for each 30 days of delay avoided, at an assumed 15 percent rate (B8).
4. Contract the fruit through registered aggregators.
Lead: Ministry of Agriculture and Livestock Development with AFA, with county governments and cooperatives. Timing: 6 to 12 months.
Action: publish a model supply contract with dry matter premiums and penalties, register aggregators and align the oil fruit calendar with AFA maturity rules.
Outcome: higher extraction yield and less immature harvesting. One point of yield is worth about US$5 million per 100,000 tonnes of fruit (B10).
Phase 2, set the rules (12 to 18 months)
5. Publish transfer pricing guidance for crude avocado oil.
Lead: KRA Domestic Taxes, with National Treasury, KEPROBA and processor associations. Timing: 12 months.
Action: issue a benchmark range or method for related-party sales, based on comparable uncontrolled sales and refined vegetable oil indices, and offer advance certainty on pricing method.
Outcome: protects the tax base and cuts dispute risk. About US$3 million of tax is at stake per US$10 million of mispriced profit at the 30 percent rate where no incentive applies (B9).
6. Establish a national avocado oil specification and accredited testing.
Lead: KEBS, with the Kenya Accreditation Service, AFA and KALRO. Timing: 12 to 18 months.
Action: publish a Kenya Standard with grades for crude, edible and cosmetic oil and accredit at least two laboratories in producing areas.
Outcome: qualifies Kenyan oil for the finished-oil price tier and cuts buyer re-testing and rejection cost. Not quantified.
Phase 3, build capacity (18 to 24 months, gated)
7. Anchor refining and cosmetic-grade fractionation in a Special Economic Zone.
Lead: SEZ Authority, with the EPZ Authority, KenInvest, National Treasury and KRA. Timing: study 6 months, build 18 to 24 months.
Action: commission a plant-level net-back study in the first six months, and proceed to site servicing in a leading producing county such as Murang’a only if the study shows a positive contribution margin against the fresh alternative. Publish the incentive package and a position on minimum tax for large groups.
Outcome: a gross value ceiling of about US$86 million per 10,000 tonnes of crude converted to finished oil, before refining loss, packaging, marketing and capital cost (B7). The study decides how much of this is real.
Closing thought
Kenya has already shown that it can grow avocados, and it has shown that buyers in Rotterdam, Dubai and Beijing will pay for them. The next test is whether Kenya can capture value from the fruit that cannot travel fresh and from the oil that foreign refiners now turn into higher-priced products. A country that presses crude oil is participating in the avocado economy, whereas a country that refines, certifies and brands its oil is shaping it, and the policy choices of the next two or three seasons will decide which of those Kenya becomes.
Annex A, assumptions
Every calculation in this article uses the inputs below. Changing an input changes the result, so readers who disagree with an assumption can substitute their own.
| Input | Value used | Grade | Where used |
|---|---|---|---|
| Implied exchange rate | KSh 130 per US dollar | Derived | Farm-gate conversion, B3 |
| Extraction rate | 8, 10 and 12 percent, about 10 kg of fruit per kg of oil | Indicative | All value-ladder tables |
| Crude oil price | US$4.61 to US$5.73 per kg, midpoint US$5.17, US$5.00 for plant illustration | Indicative | B1, B2, B7, unit economics |
| Finished oil price | US$13.77 per kg (France), US$25.16 per kg (New Zealand) | Indicative | Headroom table, B5, B7 |
| Fruit cost, farm gate | US$0.31 per kg (KNBS average) | Derived from verified | Unit economics, break-even |
| Fruit cost, domestic market 2025 | US$0.62 local, US$0.71 Fuerte, US$0.98 Hass per kg | Verified | Unit economics, break-even |
| Fresh export unit value | US$1.32 per kg, up to US$1.68 at AFA peak monthly price | Derived, Estimate | Break-even, headroom, B4 |
| Corporate tax rate | 30 percent | Verified | B9 |
| Borrowing cost on delayed refunds | 15 percent a year | Indicative | B8 |
| Refund delay | 30 days | Indicative | B8 |
Annex B, calculation sheet
| Ref | Calculation | Working | Result |
|---|---|---|---|
| B1 | Gross revenue per kg of fruit | Price per kg of product multiplied by extraction rate. Crude at US$5.17 and 10 percent | US$0.52 per kg of fruit |
| B2 | Break-even oil price | Value of the alternative use of fruit divided by extraction rate. US$0.31 divided by 0.10, and US$1.324 divided by 0.10 | US$3.10 and US$13.24 per kg of oil |
| B3 | Farm-gate price in dollars | KSh 4,030 per 100 kg is KSh 40.30 per kg, divided by 130 | US$0.31 per kg |
| B4 | Fresh export unit value | US$160.1 million divided by 120,893,000 kg. Cross-check US$159.1 million divided by 121,000,000 kg gives US$1.315. Implied rate is KSh 20.8 billion divided by US$160.1 million | US$1.324 per kg, KSh 129.9 per dollar |
| B5 | Gross headroom of finished oil over fresh | Finished price multiplied by extraction rate, less US$1.324. France at 8, 10, 12 percent, then New Zealand | France minus 0.22, 0.05, 0.33. New Zealand 0.69, 1.19, 1.70 |
| B6 | Net-back test | Contribution margin of oil per kg of fruit equals extraction rate multiplied by net realised oil price after refining loss, packaging, freight and marketing, less conversion cost and financing per kg of fruit, less fruit cost. Compare with fresh net-back equal to export unit value less packing, cold chain, freight and exporter margin | No Kenyan cost data are published, so the test is defined and not computed |
| B7 | SEZ refining ceiling | 10,000,000 kg of crude multiplied by (US$13.77 less US$5.17) | US$86.0 million gross |
| B8 | Cost of VAT refund delay | US$1,000,000 multiplied by 0.15 multiplied by 30 divided by 365 | US$12,329 |
| B9 | Transfer pricing exposure | 10,000,000 kg multiplied by US$1 per kg is US$10 million of profit, multiplied by 30 percent | US$3.0 million of tax |
| B10 | Value of extraction yield | 100,000,000 kg of fruit multiplied by 1 percent is 1,000,000 kg of oil, multiplied by US$5.00 | US$5.0 million |
| B11 | Gaps between estimates | Production (694,000 less 528,300) divided by 528,300. Yield (19.5 less 16.7) divided by 16.7 | 31.4 percent and 16.8 percent |
| B12 | Share of crop exported | 120,893 divided by 694,000, and 120,893 divided by 528,300 | 17.4 percent and 22.9 percent |
| B13 | Readings of the 10,188 tonne figure | If oil, 10,188 divided by 0.10. If fruit input, 10,188 divided by 694,000 | About 101,880 tonnes of fruit, or 1.5 percent of the crop |
| B14 | Yield comparison with Mexico | 2,973,344 divided by 253,309 hectares. Kenya 33,428 divided by 253,309 for land and 542,278 divided by 2,973,344 for tonnage | 11.7 t per hectare, 13.2 percent of land, 18.2 percent of tonnage |
All results are Derived. Their reliability is no better than the inputs listed in Annex A.
The figure of 10,188 tonnes is reported as avocado oil processing, without saying whether it measures oil output or fruit input. The reading matters, because 10,188 tonnes of oil would require roughly 100,000 tonnes of fruit at a 10 percent yield, whereas the same figure as fruit input would be only about 1.5 percent of the crop (B13).